

A fabric can provide multiple physical paths and still lose an application when a node or rank fails. Redundant links help the network survive certain link/switch failures; distributed applications must separately decide whether to retry, shrink, checkpoint or terminate.
Table 13. Failure does not necessarily mean…
| Failure | Does NOT necessarily mean | What can happen instead |
| One link fails | Entire fabric is down | SM/routing can move traffic to alternate paths if topology supports it |
| One SM fails | Packets instantly stop | Existing forwarding may continue while standby SM takes over |
| One HCA port fails | Node is unreachable | A second port/rail may remain available |
| One MPI rank fails | Network failed | Application/runtime policy may abort the job |
| One rail degrades | All traffic stops | Software may use another rail, possibly at reduced performance |
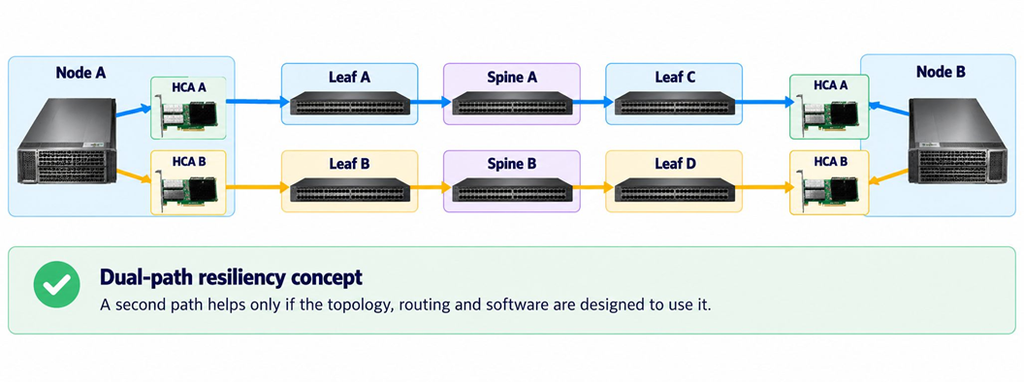
Figure 24. Dual-path resiliency concept
Traditional HPC clusters often operate as controlled environments with trusted hosts and dedicated fabrics. P_Key partitions can limit communication groups and management keys can protect control operations, but the architecture should not be mistaken for encrypted zero-trust networking. Physical access, firmware, driver integrity, management-plane authentication and workload isolation all remain security responsibilities.
Table 14. Security/isolation mechanism versus what it provides
| Mechanism | Provides | Does not automatically provide |
| P_Key partition | Logical membership/isolation of IB communication groups | Payload encryption |
| Management keys / admin controls | Protection of management operations | Endpoint identity governance for every application |
| Dedicated fabric | Reduced exposure to unrelated networks | Protection from compromised cluster nodes |
| Host OS permissions/IOMMU | Local device and DMA controls | End-to-end application authorization |
| DO NOT ASSUME: A “private” HPC fabric is not automatically a secure fabric. Dedicated cabling reduces exposure but does not replace host, firmware, identity and management controls. |
Table 15. Operational tools and the question they answer
| Tool | Question it answers | Notes |
| ibstat / ibstatus | Is the HCA port present, active and at the expected state? | Package/availability varies by distribution |
| ibv_devinfo | What verbs devices, ports and capabilities does userspace see? | Good first endpoint check |
| iblinkinfo | How are ports connected and what states/speeds are visible? | Useful topology/link view |
| ibnetdiscover | What nodes and links are in the subnet? | Topology discovery snapshot |
| perfquery | What are the port counters? | Use trends, not only single values |
| ibdiagnet | Is the fabric topology/configuration healthy? | NVIDIA diagnostic suite; capabilities vary by release |
| ibping | Can two IB management endpoints exchange test packets? | Requires server/listener arrangement |
| ib_write_bw / ib_read_bw | What microbenchmark bandwidth does a verbs operation achieve? | From linux-rdma perftest |
| ib_send_lat / ib_write_lat | What microbenchmark latency does a selected operation achieve? | Synthetic benchmark, not application latency |
| UFM | What is happening across the entire managed fabric? | Vendor-specific telemetry/operations platform |
NCCL’s current troubleshooting documentation explicitly recommends checking the Subnet Manager, port counters and ibping when diagnosing InfiniBand connectivity [R22]. The linux-rdma perftest project provides the common ib_*_bw and ib_*_lat microbenchmarks and cautions that synthetic results do not predict every real application [R23].
Table 16. Common symptoms, causes and first checks
| Symptom | Likely causes | What to check | Useful tools |
| Port down | Cable, optics, disabled port, speed mismatch | Physical state, peer, supported speed | ibstat, iblinkinfo, switch CLI |
| Lower link speed | Cable/module or negotiation limits | Active vs supported speed/width | iblinkinfo, UFM, switch CLI |
| HCA not detected | Driver, PCIe, firmware | lspci, driver logs, verbs device | lspci, dmesg, ibv_devinfo |
| No LID | No active SM or port not ACTIVE | SM status, subnet discovery | sminfo, ibstat |
| Cannot communicate | Routing/partition/address issue | LID/path/P_Key, SM health | ibping, ibnetdiscover |
| Low bandwidth | PCIe/NUMA, message size, congestion | Locality, counters, benchmark parameters | ib_write_bw, numactl, UFM |
| High latency | CPU affinity, topology hops, congestion | Small-message test, locality | ib_*_lat, topology tools |
| Poor NCCL scaling | GPU/HCA affinity, rail choice, collective topology | NCCL debug/topology, fabric counters | NCCL logs, nvidia-smi topo, UFM |
| High error counters | Bad cable/optic, signal integrity | Counter growth and peer correlation | perfquery, UFM |
| Routing imbalance | Path algorithm/hot spot/job placement | Per-port utilization and route distribution | UFM, ibdiagnet |
| OPERATIONAL NOTE: A link being ACTIVE proves connectivity, not end-to-end health. A clean fabric must also have sensible routes, low error growth, adequate headroom and expected application performance. |
Table 17. Performance metrics
| Metric | What it tells you | What it does NOT tell you |
| One-way latency | Time from source to destination under a defined test | Collective scaling or throughput |
| Round-trip latency | Request/response path delay | Unidirectional application behavior |
| Message rate | How many small operations per second can be sustained | Large-transfer throughput |
| Bandwidth | Sustained data transfer rate for a message size | Tail latency or fairness |
| Tail latency | Worst/near-worst completion behaviour | Average throughput |
| Bisection bandwidth | Cross-fabric capacity under partitioned traffic | Endpoint PCIe capability |
| Collective efficiency | How well group operations scale | Raw link rate alone |
| Scaling efficiency | How much extra compute performance additional nodes deliver | Whether the network is the only bottleneck |
Small messages are dominated by per-operation overhead, queue processing and latency. Large messages are dominated by sustained DMA, PCIe, link and memory bandwidth. A fabric can be excellent at one and merely adequate at the other, so benchmark the message-size distribution that resembles the workload.
A dual-socket server is itself a small topology. If the application thread allocates memory on one NUMA node while the HCA sits under the other socket, every transfer may cross the CPU interconnect. GPU systems add another layer because GPU-to-HCA distance affects GPUDirect performance. Modern perftest versions explicitly include NUMA-aware binding features for this reason [R23].
High-performance software tries to overlap communication with useful computation so the network is not exposed as pure idle time. This is why bandwidth, latency and GPU kernel scheduling must be evaluated together. A theoretically faster link may deliver little benefit if the workload already hides communication behind computation; conversely, a barrier-heavy job exposes every microsecond.
| PERFORMANCE NOTE: Do not optimize a synthetic peak number in isolation. The target is application time-to-solution or training throughput with stable tail behavior. |